The challenge structure is the most consequential product decision a prop firm operator makes. It determines which traders you attract, how many pass, how much capital you allocate, and whether your funded program is commercially sustainable. Set the parameters too tight and you filter out genuinely good traders while filling your pipeline with frustrated reset purchases. Set them too loose and your pass rate climbs but your funded accounts generate losses that exceed your challenge fee revenue.
Most of the content written about prop firm challenges is written for traders — how to pass, what to expect, which firms have the best rules. Very little is written for operators — how to design a challenge that works commercially, retains traders, and enforces rules at scale. This guide covers the operator perspective.

1. Why Challenge Design Determines Prop Firm Profitability
A prop firm’s revenue comes from two sources: challenge fees from traders who attempt evaluations, and profit share from traders who pass and generate returns on funded accounts. The ratio between these two revenue streams is determined almost entirely by challenge design.
A firm with a 5% pass rate generates most of its revenue from challenge fees — the vast majority of traders fail and pay again. A firm with a 25% pass rate generates more revenue from profit share but carries higher funded capital exposure. Neither model is inherently correct — but both require deliberate design decisions, not industry defaults copied from competitors.
The commercial questions every operator needs to answer before setting parameters:
- What is your target pass rate — and what funded capital exposure does that imply?
- What trader profile are you trying to attract — retail beginners, experienced discretionary traders, systematic traders?
- What is your risk model — A-Book, B-Book, or hybrid — and how does that affect how much drawdown you can absorb from funded accounts?
- What is your challenge fee pricing — and does your pass rate support a sustainable revenue model at that price point?
These questions should drive parameter decisions. Parameters should not be copied from FTMO or FundedNext and called a product.
2. Challenge Models: One-Phase, Two-Phase and Instant Funding Compared
The first structural decision is how many evaluation phases a trader must complete before receiving a funded account.
One-Phase Challenge
A single evaluation phase with one profit target — typically 8% to 10% — that the trader must hit while respecting drawdown and daily loss limits. Once passed, the trader moves directly to a funded account.
Operator considerations:
- Faster time-to-funded attracts traders who want speed
- Higher pressure per phase means more resets — good for fee revenue
- Requires tighter drawdown rules to compensate for the shorter evaluation window
- Less behavioral data on the trader before capital allocation
Two-Phase Challenge
The industry standard model. Phase 1 sets a higher profit target — typically 8% to 10%. Phase 2 sets a lower target — typically 4% to 5% — designed as a consistency verification before funded capital is allocated.
Operator considerations:
- More behavioral data before capital allocation — lower funded account risk
- Higher total challenge completion time reduces impulsive traders
- Twice the evaluation data allows better trader profiling
- Lower pass rate per phase compounds — fewer traders reach funded status
Instant Funding Model
No evaluation phase — traders pay a higher fee and receive immediate funded account access with preset risk parameters.
Operator considerations:
- Higher upfront revenue per trader
- No behavioral data before capital allocation — higher risk exposure
- Requires extremely well-designed real-time risk controls
- Attracts traders who have failed evaluations elsewhere — higher risk profile on average
Comparison Table
| Model | Phases | Typical Pass Rate | Capital Risk | Fee Revenue |
|---|---|---|---|---|
| One-Phase | 1 | 15-25% | Medium | Medium |
| Two-Phase | 2 | 8-15% | Lower | Higher |
| Instant Funding | 0 | N/A | Higher | Highest |
3. Profit Targets: How to Set Them Without Losing Good Traders
Profit targets define how much a trader must earn — as a percentage of starting account balance — to pass each phase. Industry standard ranges are:
- Phase 1: 8% to 10%
- Phase 2: 4% to 5%
- One-phase: 8% to 10%
What Operators Get Wrong
The most common mistake is setting profit targets based on what competitors charge without modelling what those targets mean for trader behavior.
A 10% profit target on a $100,000 account requires a trader to generate $10,000 in profit while staying within drawdown limits. At 1% risk per trade — which is standard disciplined risk management — that requires approximately 20 winning trades in a row at a 1:1 reward-to-risk ratio, or fewer trades at higher reward ratios. Most skilled traders can achieve this in 20 to 30 trading days.
The risk from an operator perspective is not that the target is too high — it’s that aggressive targets push traders toward oversized positions to hit the target faster, which increases drawdown breach risk and challenge failures that generate resets rather than funded accounts.
Recommended Parameters by Account Size
| Account Size | Phase 1 Target | Phase 2 Target | Rationale |
|---|---|---|---|
| $5K – $25K | 8% | 4% | Lower absolute dollar targets, appropriate pressure |
| $25K – $100K | 8-10% | 4-5% | Industry standard range |
| $100K – $200K | 10% | 5% | Higher bar justified by capital allocation size |
4. Drawdown Rules: Static vs Trailing Drawdown Explained for Operators
Drawdown rules define the maximum loss a trader can sustain — in total and per day — before the challenge is terminated. This is the most important risk control parameter in your challenge design, and the choice between static and trailing drawdown has significant commercial implications.
Static Drawdown
A fixed loss limit calculated from the starting account balance that does not move regardless of profits earned.
Example: $100,000 account with 10% static drawdown. Maximum loss threshold is $90,000. If the trader grows the account to $115,000, the threshold remains at $90,000 — giving the trader $25,000 of cushion.
Operator implication: Static drawdown is more trader-friendly. It allows profitable traders to build a buffer that protects them from a losing streak. Pass rates are higher. Funded capital exposure is higher because you’re allocating to traders who passed with more room to maneuver.
Trailing Drawdown
A loss limit that moves upward with the trader’s equity peak — but never downward.
Example: $100,000 account with 6% trailing drawdown. Initial threshold is $94,000. Trader grows to $106,000 — threshold moves to $100,000. Trader then pulls back to $100,000 — challenge ends, threshold was breached.
Operator implication: Trailing drawdown is significantly more restrictive. Pass rates are lower. Reset revenue is higher. But it also means the traders who do pass have demonstrated discipline under genuinely difficult conditions — lower funded account risk.
Which to Choose
Most established firms use static drawdown for two-phase challenges and trailing drawdown for one-phase challenges. The logic: a two-phase model already provides two layers of behavioral filtering, so static drawdown is appropriate. A one-phase model needs tighter controls to compensate for the single evaluation window.
The full technical implementation of drawdown monitoring and real-time rule enforcement at scale is examined in detail here.
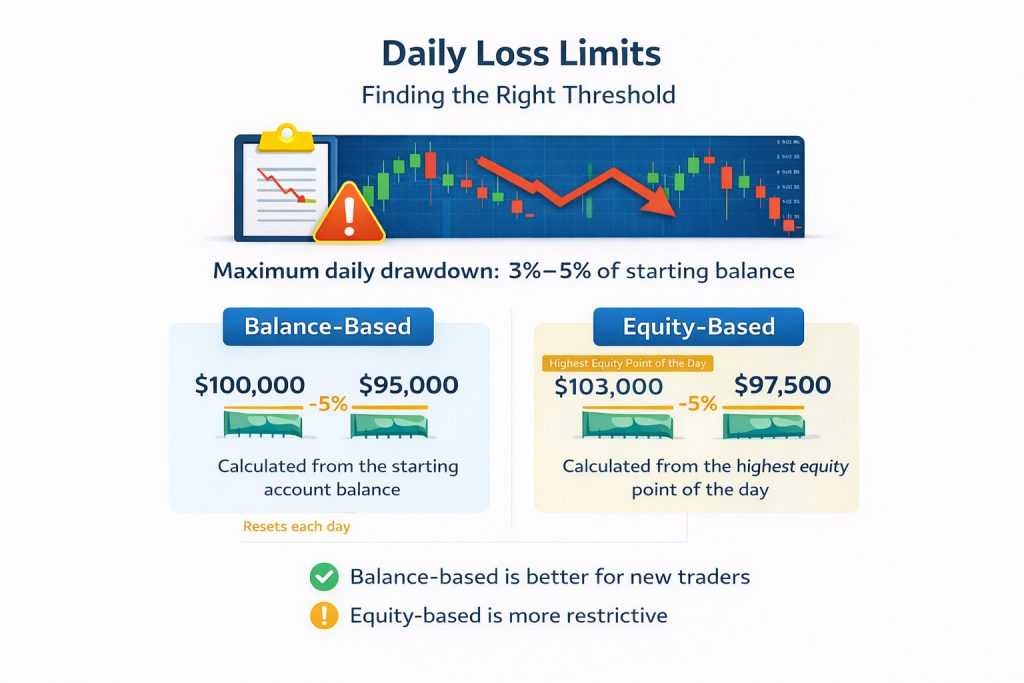
5. Daily Loss Limits: Finding the Right Threshold
The daily loss limit — also called the maximum daily drawdown — caps how much a trader can lose in a single trading session before the challenge is suspended for that day or terminated entirely.
Industry standard: 3% to 5% of starting account balance.
How Daily Loss Is Calculated
Two calculation methods exist and operators must choose one explicitly:
Balance-based: Daily loss limit calculated from the account balance at the start of each trading day. Resets at midnight server time.
Equity-based: Daily loss limit calculated from the highest equity point reached during the trading day. More restrictive — a trader who reaches $103,000 from $100,000 then pulls back to $97,500 has breached a 5% equity-based daily limit even though their end-of-day balance shows only a 2.5% loss from opening.
The equity-based calculation is significantly more restrictive and generates more challenge failures. Most established firms use balance-based calculation for Phase 1 and equity-based for Phase 2 or funded accounts.
6. Minimum Trading Days and Time Parameters
Minimum trading day requirements prevent traders from getting lucky in one or two sessions and claiming funded capital on the basis of a short track record.
Industry standard: 4 to 10 minimum trading days per phase.
Why This Matters for Operators
Without a minimum trading day requirement, a trader could conceivably hit a 10% profit target in two or three aggressive sessions and qualify for a funded account. The behavioral data you have on that trader is minimal — you’ve seen two days of trading, not twenty.
Minimum trading days ensure that funded traders have demonstrated their approach across a range of market conditions, not just a single favorable period. The cost is a longer time-to-funded for legitimate traders — which creates friction but also filters impulsive participants.
Maximum Time Limits
Some firms impose maximum time limits — 30 or 60 calendar days to complete a phase. Others offer unlimited time.
Operator consideration: Unlimited time is a significant competitive advantage in trader acquisition — it removes deadline pressure that causes forced trading decisions. The commercial cost is that challenges stay open longer, delaying either conversion to funded or reset revenue. Most firms offering unlimited time offset this with slightly tighter drawdown parameters.
7. Consistency Rules: The 20-25% Single-Day Cap
A consistency rule limits how much of a trader’s total profit can be generated in a single trading day — typically 20% to 25% of the total profit target.
Example: $100,000 account with a 10% profit target ($10,000). With a 25% consistency rule, no single trading day can account for more than $2,500 of that $10,000.
Why Operators Use Consistency Rules
Consistency rules prevent a trader from passing on one outsized trade that doesn’t reflect their actual skill level. A trader who hits $10,000 profit in one session and then trades flat for the remainder of the challenge has not demonstrated consistent risk management — they’ve demonstrated one good trade.
The Operator Trade-Off
Consistency rules significantly reduce pass rates — which increases reset revenue in the short term but can damage reputation if traders feel the rules are designed to make passing impossible rather than to filter genuine skill. The threshold matters: a 20% cap is aggressive, a 35% cap is more reasonable for most trading styles.
8. Trading Restrictions: Instruments, News Events and Strategy Rules
Beyond the core financial parameters, challenge rules typically include restrictions on what traders can trade and how they can trade it.
Common Restrictions and Their Rationale
News trading restrictions: Many firms restrict trading during high-impact news events — NFP, FOMC, CPI — because news-driven volatility can generate outsized moves that breach drawdown limits in seconds. From an operator perspective, news restrictions reduce extreme tail risk on challenge accounts.
Instrument restrictions: Most challenges restrict trading to specific instruments — major forex pairs, indices, commodities, sometimes crypto. Exotic pairs, low-liquidity instruments, and illiquid session trading create pricing anomalies that sophisticated traders can exploit.
Overnight and weekend holding: Rules on overnight positions and weekend holds vary. Firms that hedge their funded book need to manage overnight exposure. Operators with a B-Book model may be more tolerant of overnight positions.
Lot size limits: Maximum position size limits prevent traders from doubling down on a single directional bet. Typically expressed as a maximum number of lots per instrument or as a percentage of account balance per open position.
Expert advisor and copy trading: Most firms prohibit third-party signal services and copy trading. Some allow automated strategies but prohibit those that exploit platform latency or pricing errors.
9. Account Sizes and Challenge Fee Pricing
Challenge fees are the primary revenue driver for most prop firms. Pricing should reflect account size, challenge difficulty, and competitive positioning — not be copied from competitors.
Industry Standard Fee Ranges
| Account Size | Typical Challenge Fee | Fee as % of Account |
|---|---|---|
| $5,000 | $50 – $100 | 1-2% |
| $25,000 | $150 – $250 | 0.6-1% |
| $50,000 | $250 – $400 | 0.5-0.8% |
| $100,000 | $400 – $700 | 0.4-0.7% |
| $200,000 | $800 – $1,200 | 0.4-0.6% |
Promo Codes and Discount Strategy
Challenge fee discounts — through promo codes, seasonal campaigns, and affiliate-specific codes — are one of the most effective conversion tools available to prop firm operators. A well-structured promo code system gives operators precise control over discount depth, duration, and channel attribution. The implementation of promo code logic within a prop firm CRM is outlined here.
10. Scaling Plans: How to Keep Funded Traders Long-Term
A scaling plan defines how a funded trader’s allocated capital grows over time based on consistent performance. It is one of the most important retention tools available to prop firm operators — and one of the most underdesigned.
Standard Scaling Logic
- Trader achieves X% profit over Y consecutive months → allocated capital increases by Z%
- Maximum capital allocation cap — typically $400,000 to $2,000,000 depending on the firm
- Drawdown parameters on funded accounts — typically more relaxed than challenge parameters
Why Scaling Plans Matter for Retention
A funded trader who can see a clear path to larger capital allocation has a reason to stay with the firm long-term. A funded trader with no scaling path has every incentive to find a firm that offers one.
Monitoring funded trader performance, tracking scaling eligibility, and managing the dashboard experience for funded accounts is covered here.

11. Competitions as a Challenge Supplement
Trading competitions serve a dual purpose in challenge design — they function as a pre-evaluation funnel that attracts traders before they commit to a paid challenge, and as an ongoing engagement mechanism for funded traders between evaluation cycles.
A well-designed competition module allows operators to run free or paid competitions with configurable scoring logic, real-time leaderboards, and automated prize distribution. The best performers from competitions are natural candidates for challenge purchases. For operators evaluating competition infrastructure, the full feature set is available here.
12. How CRM Infrastructure Enforces Challenge Rules at Scale
Designing the rules is one task. Enforcing them in real time across hundreds or thousands of active challenge accounts simultaneously is another matter entirely.
Manual rule enforcement is not viable at scale. A risk team monitoring challenge accounts manually cannot respond fast enough to a daily loss limit breach during a volatile news event. By the time a human intervenes, the position has grown and the damage is done.
Effective challenge rule enforcement requires:
- Real-time integration between the trading platform and the back office — so rule breaches are detected at the moment they occur, not after the fact
- Automated account actions — positions closed and accounts suspended automatically on breach, without waiting for human intervention
- Audit trail — every breach logged with timestamp and trading data for dispute resolution
- Dashboard visibility — risk desk can see all active challenge accounts simultaneously with live breach alerts
The prop firm CRM infrastructure that makes this possible — including real-time risk monitoring, automated rule enforcement, and full audit logging — is documented in detail here.
Summary: Key Parameters at a Glance
| Parameter | Industry Standard | Operator Consideration |
|---|---|---|
| Phase 1 Profit Target | 8-10% | Higher = more resets, lower = more funded risk |
| Phase 2 Profit Target | 4-5% | Consistency verification layer |
| Max Drawdown | 8-12% | Static vs trailing affects pass rate significantly |
| Daily Loss Limit | 3-5% | Balance-based vs equity-based calculation |
| Min Trading Days | 4-10 days | More days = better behavioral data |
| Consistency Rule | 20-25% single day cap | Optional but reduces lucky-streak passes |
| Challenge Fee | 0.4-2% of account | Price to competitive positioning |
| Profit Share | 70-90% | Higher split = better trader retention |

Request a Consultation on Designing a Prop Firm Challenge Structure
Get expert guidance on structuring a commercially sustainable prop firm challenge. We’ll help you evaluate profit targets, drawdown models, pass-rate strategy, and pricing logic to ensure your evaluation program balances trader attraction with long-term capital protection.
Together, we’ll review your current challenge parameters and outline a framework aligned with profitability, scalability, and trader retention.